HADS Network - other tables for IL include: All Networks, CWOP/APRS, METAR, RAWS, see our homepage.
|
Also try the full-featured calculator/DD model | |
|
| |||||||||||||||||||||||||
|
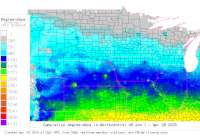
Illinois USA Weather Data, Plant Disease Risk and Degree-Day Models HADS Network - other tables for IL include: All Networks, CWOP/APRS, METAR, RAWS, see our homepage. | |||||||||||||||||||||||||
| |||||||||||||||||||||||||
| # | Location linked to hourly weather, plant disease models and forecasts using "Mypest Page" |
County |
Re- cent data QA |
Fore- cast based virt data |
Nearby station based virt data |
Station code, links to NWS recent weather |
Links to NWS fore- casts |
Net- work Elev. (ft) |
Lat./ Long. (Dec. Deg.) |
Max-min temperature data and degree-days (click radio button to calc.) |
10 yr avgs |
30 yr avgs |
nmme fcast |
cfs fcast |
||||||||||
|---|---|---|---|---|---|---|---|---|---|---|---|---|---|---|---|---|---|---|---|---|---|---|---|---|
| 1 | BIG MUDDY SUBIMPOUNDME | Jefferson Co |
|
na na |
na na |
|
|
402 | 38.17583 -89.00639 | nmme | ||||||||||||||
| 2 | CASEY Fk SUBIMPOUNDMEN | Jefferson Co |
|
na na |
na na |
|
|
400 | 38.18750 -88.92694 | Virtual | nmme | |||||||||||||
| 3 | DEVILS KITCHEN Lk @ MA | Williamson C |
|
na na |
na na |
|
|
495 | 37.64278 -89.10250 |
2021
|
2020
|
2019
|
2018
|
2017
|
2016
|
AVG | AVG | nmme | cfs | |||||
| 4 | ELMHURST QUARRY AT ELM | Cook County |
|
na na |
na na |
|
|
672 | 41.89889 -87.96389 |
2021
|
nmme | cfs | ||||||||||||
| 5 | FONDULAC Cr @ E PEORIA | Peoria Count |
|
na na |
na na |
|
|
528 | 40.67694 -89.53083 |
2021
|
2020
|
2019
|
2018
|
2017
|
2016
|
AVG | AVG | nmme | cfs | |||||
| 6 | ILL RVR AT STARVED ROC | La Salle |
|
na na |
na na |
|
|
460 | 41.33306 -88.85000 |
2021
|
2020
|
2019
|
2018
|
2017
|
2016
|
AVG | AVG | nmme | cfs | |||||
| 7 | ILLINOIS RVR AT BRANDO | Cook |
|
na na |
na na |
|
|
543 | 41.50417 -88.10806 |
2021
|
2020
|
2019
|
2018
|
2017
|
2016
|
AVG | AVG | nmme | cfs | |||||
| 8 | ILLINOIS RVR AT LOCK | Grundy |
|
na na |
na na |
|
|
505 | 41.39806 -88.27917 |
2021
|
2020
|
2019
|
2018
|
2017
|
2016
|
AVG | AVG | nmme | cfs | |||||
| 9 | ILLINOIS Rvr AT LOCKPt | Cook |
|
na na |
na na |
|
|
590 | 41.56944 -88.07806 |
2021
|
2020
|
2019
|
2018
|
2017
|
2016
|
AVG | AVG | nmme | cfs | |||||
| 10 | ILLINOIS Rvr AT NEW LA | Cass County |
|
na na |
na na |
|
|
436 | 39.94028 -90.53417 |
2021
|
2020
|
2019
|
2018
|
2017
|
2016
|
AVG | AVG | nmme | cfs | |||||
| 11 | ILLINOIS Rvr AT PEORIA | Peoria Count |
|
na na |
na na |
|
|
442 | 40.63167 -89.62500 |
2021
|
2020
|
2019
|
2018
|
2017
|
2016
|
AVG | AVG | nmme | cfs | |||||
| 12 | ILLINOIS Rvr AT Val Ct | Pike |
|
na na |
na na |
|
|
417 | 39.70917 -90.64639 |
2021
|
2020
|
2019
|
2018
|
2017
|
2016
|
AVG | AVG | nmme | cfs | |||||
| 13 | ILLINOIS Rvr LOCK + DA | Cook County |
|
na na |
na na |
|
|
593 | 41.65000 -87.56083 |
2021
|
2020
|
2019
|
2018
|
2017
|
2016
|
AVG | AVG | nmme | cfs | |||||
| 14 | ILLINOIS Rvr MET Stn A | La Salle Cou |
|
na na |
na na |
|
|
482 | 41.32583 -88.71444 |
2021
|
2020
|
2019
|
2018
|
2017
|
2016
|
AVG | AVG | nmme | cfs | |||||
| 15 | LE ROY 1S | McLean Count |
|
na na |
na na |
|
|
784 | 40.33194 -88.76056 |
2021
|
2020
|
2019
|
2018
|
2017
|
AVG | AVG | nmme | cfs | ||||||
| 16 | MISS RVR AT LOCK + DAM | Des Moines |
|
na na |
na na |
|
|
538 | 40.88306 -91.03306 |
2021
|
2020
|
2019
|
2018
|
2017
|
2016
|
AVG | AVG | nmme | cfs | |||||
| 17 | MISS RVR AT LOCK + DAM | Rock Island |
|
na na |
na na |
|
|
550 | 41.43056 -91.02194 |
2021
|
2020
|
2019
|
2018
|
2017
|
2016
|
AVG | AVG | nmme | cfs | |||||
| 18 | MISS RVR AT LOCK + DAM | Louisa |
|
na na |
na na |
|
|
548 | 41.19417 -91.05806 |
2021
|
2020
|
2019
|
2018
|
2017
|
2016
|
AVG | AVG | nmme | cfs | |||||
| 19 | MISS RVR AT LOCK + DAM | Adams |
|
na na |
na na |
|
|
483 | 39.90417 -91.43667 |
2021
|
2020
|
2019
|
2018
|
2017
|
2016
|
AVG | AVG | nmme | cfs | |||||
| 20 | MISSISSIPPI Rvr AT ALT | Madison Coun |
|
na na |
na na |
|
|
416 | 38.88639 -90.18278 |
2021
|
2020
|
2019
|
2018
|
2017
|
2016
|
AVG | AVG | nmme | cfs | |||||
| 21 | MISSISSIPPI Rvr AT LOC | Clinton Coun |
|
na na |
na na |
|
|
580 | 41.89417 -90.15667 |
2021
|
2020
|
2019
|
2018
|
2017
|
2016
|
AVG | AVG | nmme | cfs | |||||
| 22 | MISSISSIPPI RVR LOCK | Rock Island |
|
na na |
na na |
|
|
542 | 41.51667 -90.56333 |
2021
|
2020
|
2019
|
2018
|
2017
|
2016
|
AVG | AVG | nmme | cfs | |||||
| 23 | SALINE BRANCH @ URBANA | Champaign Co |
|
na na |
na na |
|
|
695 | 40.12889 -88.15139 |
2021
|
2020
|
2019
|
2018
|
2017
|
2016
|
AVG | AVG | nmme | cfs | |||||
| 24 | WAUKEGAN HARBOR | Lake |
|
na na |
na na |
|
|
630 | 42.35083 -87.80806 |
2021
|
2020
|
2019
|
2018
|
2017
|
2016
|
AVG | AVG | nmme | cfs | |||||
| 25 | WILL Co RAIN AT HOMER | Cook County |
|
na na |
na na |
|
|
764 | 41.61444 -87.97167 | nmme | ||||||||||||||
[USPEST.ORG/WEA Home]
[Intro]
[US DD Mapmaker]
[Main Table Index]
[Links]


|